Last modified on March 22nd, 2024 at 9:52 am
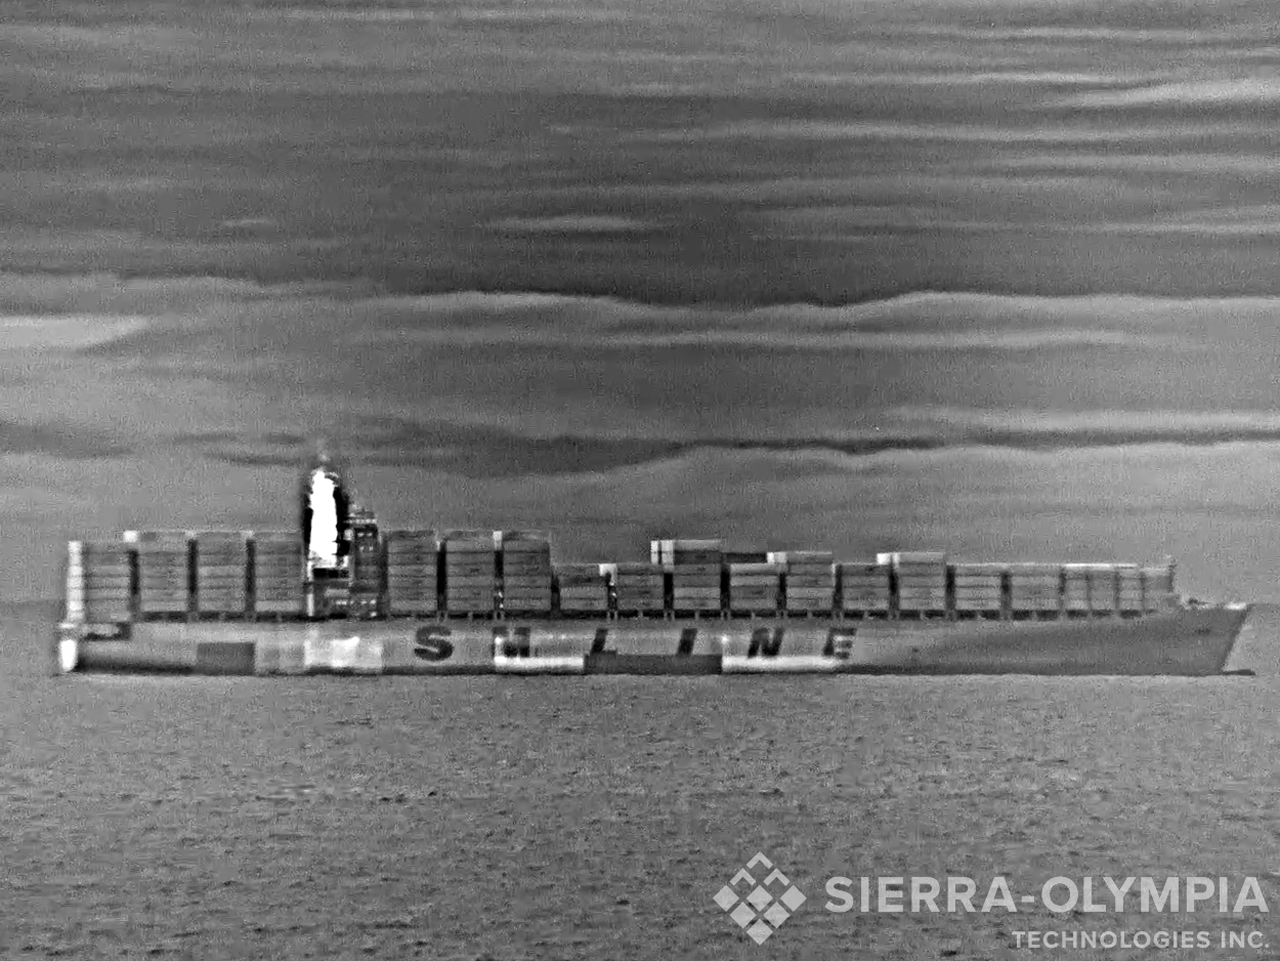
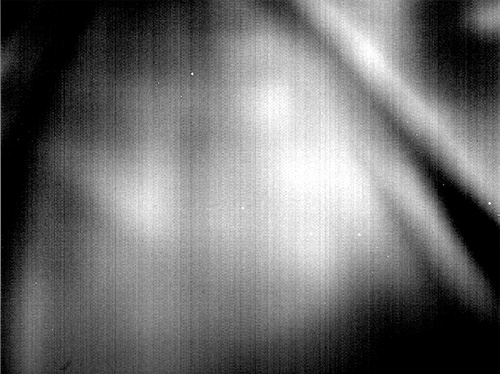
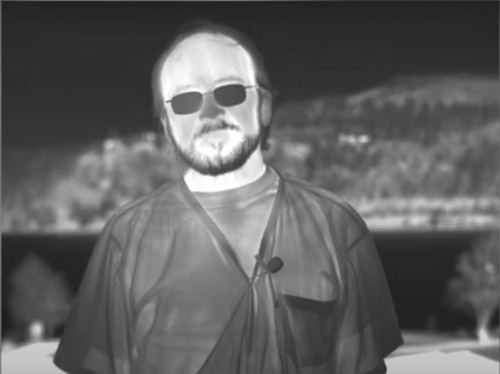
What we see in figure A is an uncorrected infrared image. You can see some of the variation between the pixels and areas that stick out from the surrounding ones. Figure B adds the correction and you see the smooth quality IR image you’re used to seeing from Sierra-Olympia products. Let’s talk about how the non-uniformity correction(NUC) process works and how we do it here at Sierra-Olympia
Infrared sensors are made from exotic materials using advanced processing techniques each individual detector in the sensor has its own characteristic in the way it responds to incoming infrared light. Each detector, you might say, has its own personality compared with those around it. How we create a good-looking IR image out of that, is a non-uniformity correction or what we call a NUC.
What’s NUC?
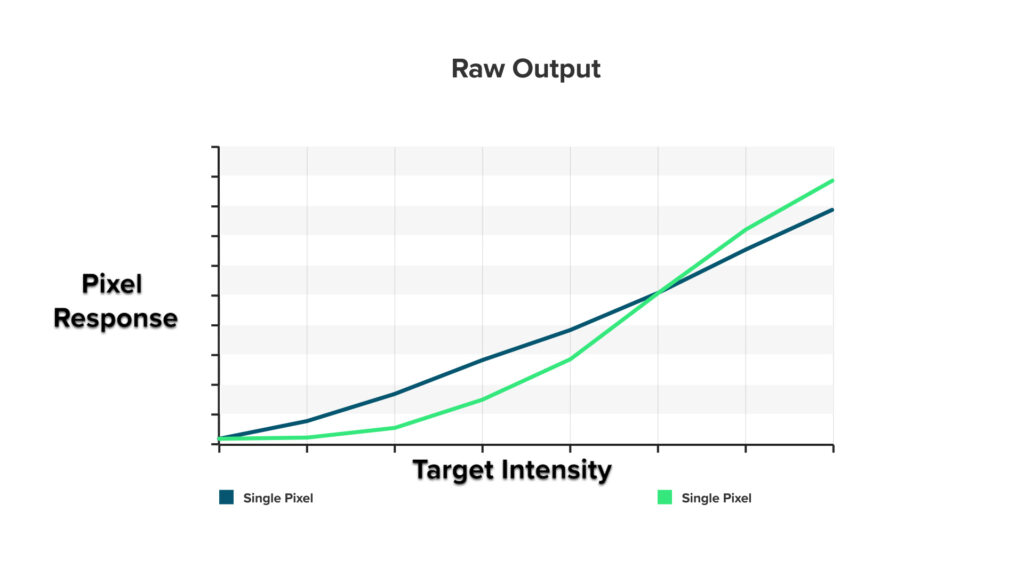
Part 1: A non-uniformity correction. That answer has two parts. The first part happens at our factory, in the testing process on our cameras. We use a area black body, which is a device that’s able to show a uniform scene to the sensor. We can then vary that temperature to give it different intensities. You can imagine showing a lower intensity image and a higher intensity image to a certain pixel, and we can plot the intensities on the x axis and the response of the pixel on the Y axis. We can find the characteristic of that one pixel and plot it. If we do that on another pixel, let’s say the adjacent pixel to that one, we’re going to find that that pixel will have a slightly different characteristic. The reason this happens is because even as the same material on the same substrate, the way that we make detectors happens at a micro scale or the scale of making microchips. The detectors in this camera are 15 microns in size. The detectors in some of our other cameras are 12 microns, 10 microns, even 6 microns in size. You can read about microbolotmeters in a previous blog for more information. We use an automated computer program to go through each of the 300,000 pixels in the array and alter each one individually, so that the entire array becomes uniform. Figure C represents the different characteristics of two pixels.
Part 2: For the second phase of non-uniformity correction, we need to load all those calculated coefficients into the camera so that it can do the corrections while it’s imaging. We take that for granted because once we load those coefficients into the camera, it starts working and creates a beautiful image for us. We try to remember that we’re creating 30 frames per second of image data. Each of those frames has 300,000 pixels in it, and every single one of those pixels needs to receive its correction to bring it in line with the rest. There are millions of pixels per second getting corrected in order to create the uniform image out of this camera.
Pushing the Envelope
Here at Sierra Olympia, we are experimenting with other ways of doing non-conformity correction. You can imagine that some pixels maybe don’t respond in a straight line across all intensities. Maybe they have a curved characteristic to them and if different pixels on the array have slightly different curves, that’s another way that non uniformity can come into an image. A representation of this can be seen in Figure D. We’ve been experimenting with using a three-point correction where not only do we just move the two points around, but we can also change the shape of that curve and make differently shaped curves match up with each other so that the image remains uniform across the entire range of intensities.
Another way non-uniformity can be introduced into either image is through the optical system. In those types of cases, Sierra-Olympia has developed a NUC through Zoom capability where we can calculate multiple nuc tables, multiple nuc sets and switch them as a lens goes through its different positions in order to make the best possible image at each zoom position. An example of this is shown in Figure E.
Thanks for reading this tech talk. I hope this has helped to describe how we take groups of hundreds of thousands of pixels in a detector array and bring all of their characteristics together to form a nice uniform image.